
What if you could adjust every rep to match a client’s daily readiness without guessing?
Short answer: Velocity‑based training (VBT) uses real‑time bar‑speed data to auto‑regulate load, cut wasted volume, and keep athletes training in the optimal speed zone—perfect for remote coaching with Bluetooth sleeves and Spur Fit’s video‑analysis tools.
For years most online coaches have relied on static percentages of 1‑RM, hoping that 80 % feels “light” on a good day and “heavy” on a bad one. The reality is that daily fluctuations in sleep, nutrition, and stress can swing an athlete’s true capacity by 10‑15 %. When you prescribe a fixed load, you either under‑load a ready client or over‑load a fatigued one, leading to wasted reps, unnecessary soreness, or even injury.
Enter velocity based training, the science‑backed method that replaces guesswork with a measurable metric: bar speed in meters per second. By tracking concentric velocity, you can decide on the spot whether to add weight, hold steady, or back off—essentially turning every session into a personalized autoregulation protocol.

Why VBT Beats Percentage‑Based Loading
Traditional percentage schemes assume a linear relationship between load and performance, but research from 2023‑2025 shows that velocity is a far more sensitive indicator of neuromuscular readiness. A systematic review (2023) found that keeping velocity loss below 20 % preserves power output and sprint performance, while higher loss (>30 %) shifts the stimulus toward hypertrophy. In other words, the same lift can be used for strength, power, or size simply by adjusting the speed target and the allowed velocity drop.
Moreover, a meta‑analysis of proximity‑to‑failure studies demonstrated that athletes achieve comparable muscle growth at 1‑2 reps in reserve (RIR) as long as the mean bar speed stays above 0.4 m/s. This means you can avoid training to absolute failure—saving joint stress—while still delivering hypertrophic results.
Key Benefits for Online Coaches
- Immediate feedback: Clients see a green‑yellow‑red speed gauge on their phone, making the concept intuitive.
- Reduced junk volume: Sets stop automatically when the velocity‑loss threshold is reached, eliminating needless reps.
- Scalable data: Every session uploads to Spur Fit, where AI summarises trends and flags days that need deloading.
- Higher motivation: Studies show athletes push harder when chasing a speed target rather than a rep count.
Building a Load‑Velocity Profile Remotely
The cornerstone of any VBT program is a personalized load‑velocity curve. Here’s a step‑by‑step process that works with a basic Bluetooth sleeve and Spur Fit’s video upload feature:
- Collect baseline data: Have the client perform three reps at 40 %, 60 %, and 80 % of an estimated 1‑RM for the main lift (e.g., squat, bench press). Record the mean concentric velocity for each set.
- Plot the curve: Input the three points into Spur Fit’s “Velocity Builder” tool; the software extrapolates the full curve and predicts 1‑RM based on velocity.
- Define zones: Typical zones are:
- Strength‑speed: 0.5–0.75 m/s
- Power: 0.75–1.0 m/s
- Speed‑strength: >1.0 m/s
- Set loss caps: For power focus, stop the set when velocity drops 20 % from the first rep; for hypertrophy, allow up to 40 % loss.
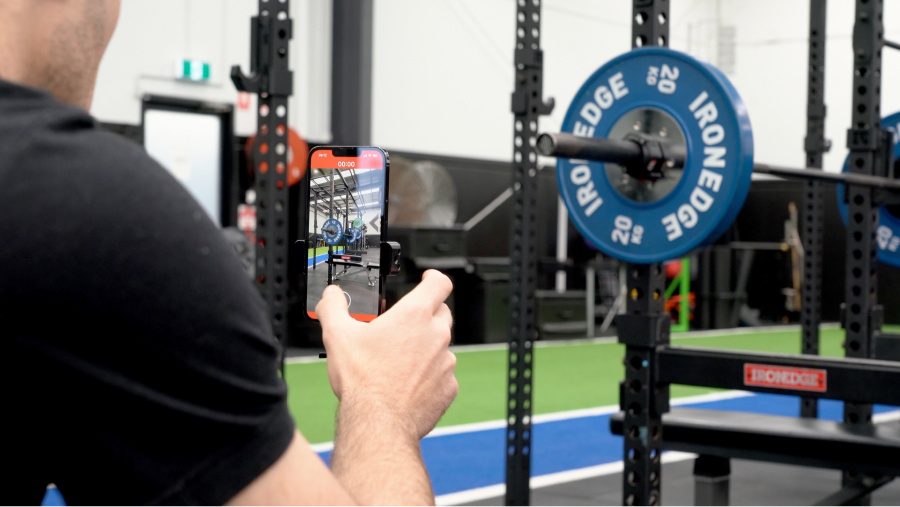
- Integrate video: Ask clients to film the lift from a consistent angle. Spur Fit auto‑extracts the bar‑speed curve and attaches it to the session log.
Hardware Options That Fit Any Budget
You don’t need a $4,000 linear position transducer to start. Choose the tool that matches your client base:
Cost‑effective, portable, and accurate to ±0.03 m/s. Ideal for home gyms and traveling athletes.
Use a phone camera plus AI pose estimation. Zero hardware cost; great for trial phases.
Laser or infrared systems for elite teams. Provide sub‑0.01 m/s precision when you need it.
Four‑Step Framework to Deploy VBT at Scale
- 1Build the profile
Film triples across the load spectrum, upload to Spur Fit, and let the AI generate the curve.
- 2Assign velocity zones
Map each client’s program to the appropriate speed band (strength, power, or speed).
- 3Program loss thresholds
Set 20 % loss for power days, 40 % for hypertrophy, and automatically terminate sets when the limit is hit.
- 4Review and coach
Spur Fit’s AI summary highlights “green‑zone” reps and suggests cues for the next session.
Practical Coaching Tips
- Use traffic‑light language: Green = hit target speed, Yellow = slight slowdown, Red = stop.
- Emphasise intent: Tell clients to lift “as fast as possible” while maintaining technique; velocity will self‑regulate the load.
- Daily auto‑adjustment: If the first rep’s speed is 5 % below the zone, reduce the load by 2.5‑5 % before the set begins.
- Integrate with RPE/RIR: Pair velocity data with perceived effort to give a fuller picture of fatigue.

Frequently Asked Questions
- Yes. Modern Bluetooth sleeves measure mean concentric velocity within ±0.03 m/s, which is sufficient for load‑adjustment decisions in most coaching scenarios.
- For most online programs, daily velocity predicts 1‑RM within a 5 % margin of error, eliminating the need for frequent maximal tests.
- Use a simple traffic‑light analogy: green means the bar moved fast enough, yellow signals a slight slowdown, and red means the set should end.
- Spur Fit’s mobile app can capture bar‑speed directly from the sleeve’s Bluetooth data, so video is optional for basic VBT.
- Yes. By setting a higher velocity‑loss cap (e.g., 30‑40 %), you can keep the set in the hypertrophy zone while still monitoring fatigue.